Report Generation
LeaveWizard includes comprehensive report generation capabilities and provides five different basic leave reports that administrators can generate from within the application. If you enable ‘Bradford Factor’ calculation for the company, then a ‘Bradford Factor’ report will also be available. This is additional to a Monthly Allowance report email, which the system can generate and automatically send to users. You can get more information about that in the separate Monthly Allowance report article. The reports pages are accessible from the ‘Leave’ drop-down section of the main menu.
Leave & Absence
The Leave and Absence Report provides a list of requests which you can filter by workgroup, employee, event type, start date and end date. You can also choose to include ex-employees in the report by ticking the ‘Include Ex-Employees’ box.

The system paginates the results, and you can select the page size. Initially, it sorts the list by ‘Name’, the first column of the list, in ascending order. You can, however, sort by any column (start date, end date, duration, creation date or status) by clicking the column title. Clicking the same column again will alternate between ascending and descending order. For example, clicking ‘Start Date’ will sort the previous list as follows:

There is also a range of buttons available on the page sub menu to allow easy access to common functions such as requesting leave, absence and overtime. The ‘Export to Excel (csv)’ button allows you to export the generated list as a CSV (Comma Separated Value) file. You can view it in Excel and other applications.
Remaining Allowances
The Remaining Allowances Report provides a list of users and their allowance information. You can filter the list by workgroup, employee, event type and year. The ‘Export to Excel (csv)’ button allows you to export the generated list as a CSV (Comma Separated Value) file. You can view it in Excel and other applications.

Besides getting the remaining allowance report, it is also possible to generate a time worked report for any user for the previous month from this page. On the far right-hand side of each row of the user list is a time worked export icon. Clicking this will export a time worked report as a CSV file. For example, clicking the icon for a user will create and download a CSV file, which you can view using Excel as shown.

As you can see, it uses the user’s work pattern and leave information to create a report showing the hours worked by them for the previous month. Here, they have only taken one day as a holiday in the month.
Leave Taken By Month
This is a more advanced report listing the monthly summary of allowance, remaining, used, etc. You can filter the information by workgroup, employee, event type and year. Initially, it sorts the list by ‘Index’, the first column of the list, in ascending order. You can, however, sort by any column by clicking the column title. Clicking the same column again will alternate between ascending and descending order. There are buttons with a spreadsheet icon on the far right-hand side, at the top and bottom of the list. These allow you to export the generated list as a CSV (Comma Separated Value) file.
There is also a range of buttons available on the page sub menu to allow easy access to common functions such as requesting leave, absence and overtime.

You can group the data in the report by columns. You can do this by dragging any column header and dropping it onto the row at the top with ‘Drag a column header and drop it here to group by that column’ displayed.
There is also a link ‘Click here to download a sample MS Excel file with a pre-configured pivot table’, which allows you to download a template Excel file with a ‘Pivot Table’. You can use pivot tables to reorganise and summarise selected columns and rows of data in a spreadsheet and you can use this template to do that for the data generated by this report.
Leave By Month Pivot
This is our most advanced report, which has a wide range of options available. You can filter the information by workgroup, employee, event type and year. Coverage of all the options is, however, beyond the scope of this article.

Absence Taken By Month
The Absence Taken By Month Report provides a list of users with their absence taken each month. You can filter the list by workgroup, employee, event type and year. Clicking the ‘Employee Name’ button will alternate the user sort order between ascending and descending order. Clicking the ‘Index’ and ‘Month’ buttons will arrange the month columns in ascending and descending ‘Index’ or ‘Month’ order.

There is also a range of buttons available on the page sub menu to allow easy access to common functions such as requesting leave, absence and overtime.
Bradford Factor
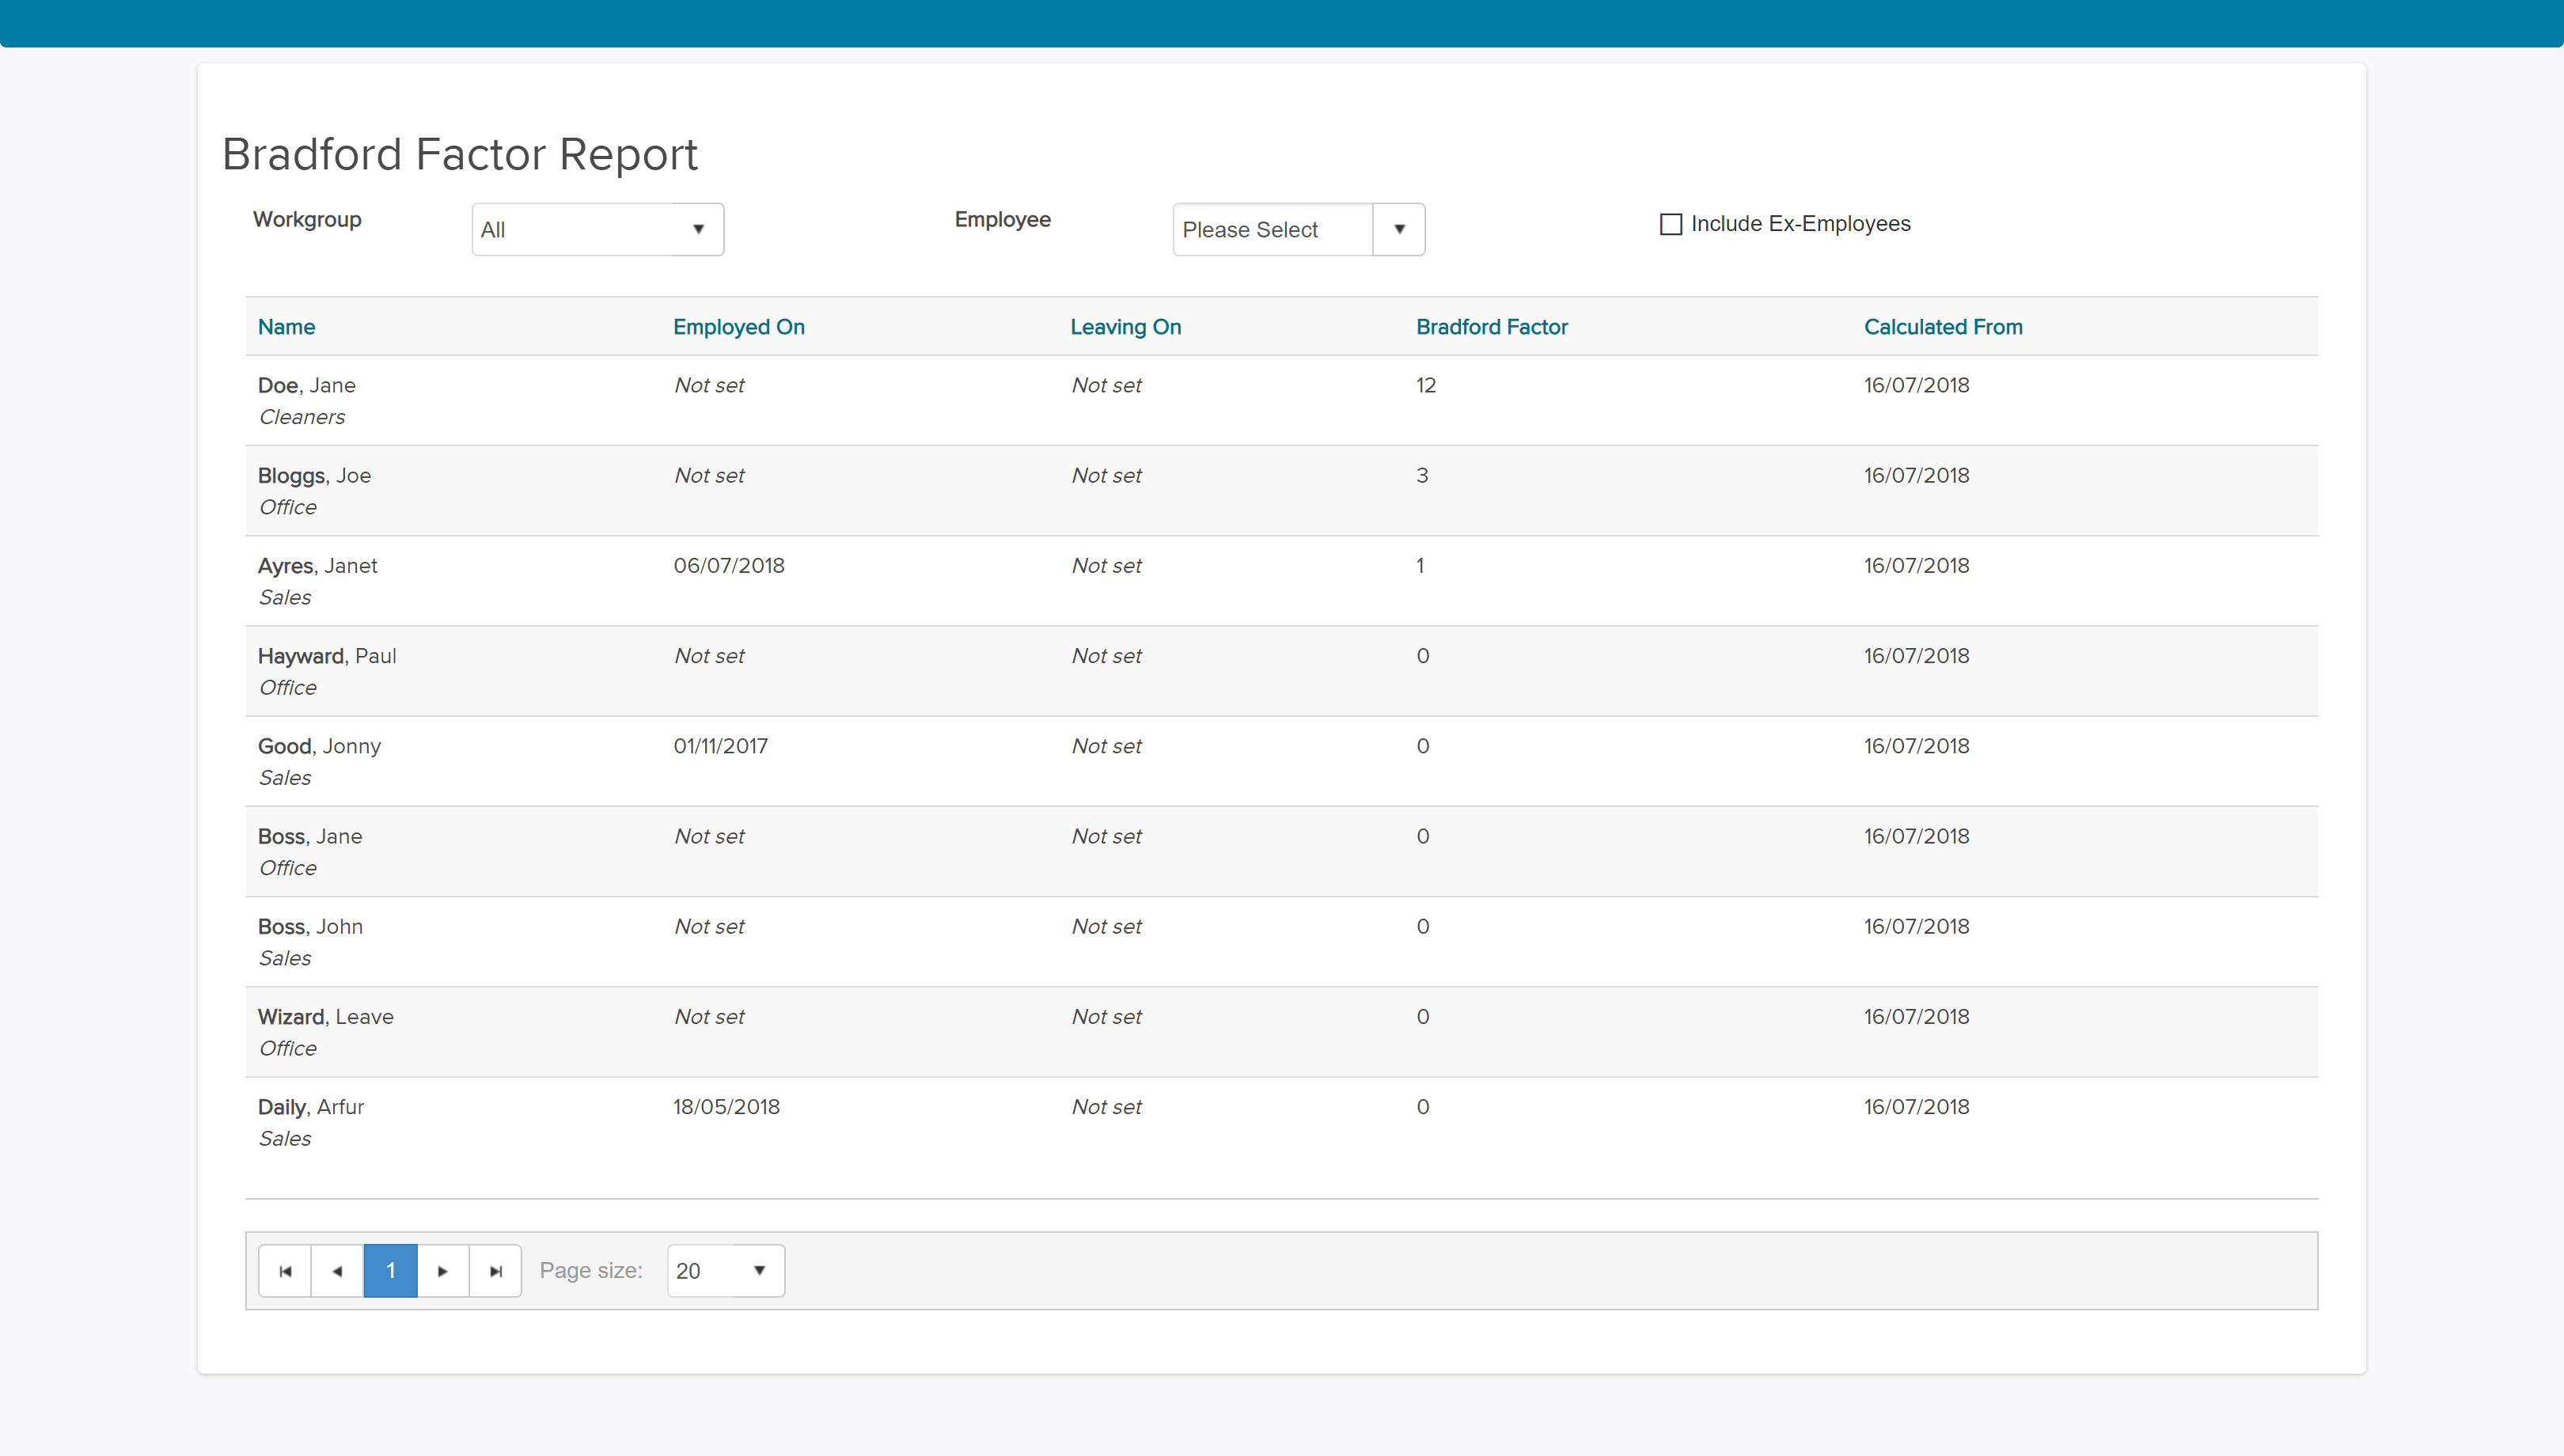
If you have enabled ‘Bradford Factor’ calculation for the company, then this report becomes available. It provides a list of users and their Bradford Factor calculations, which you can filter by workgroup and employee. You can also choose to include ex-employees in the report by ticking the ‘Include Ex-Employees’ box.
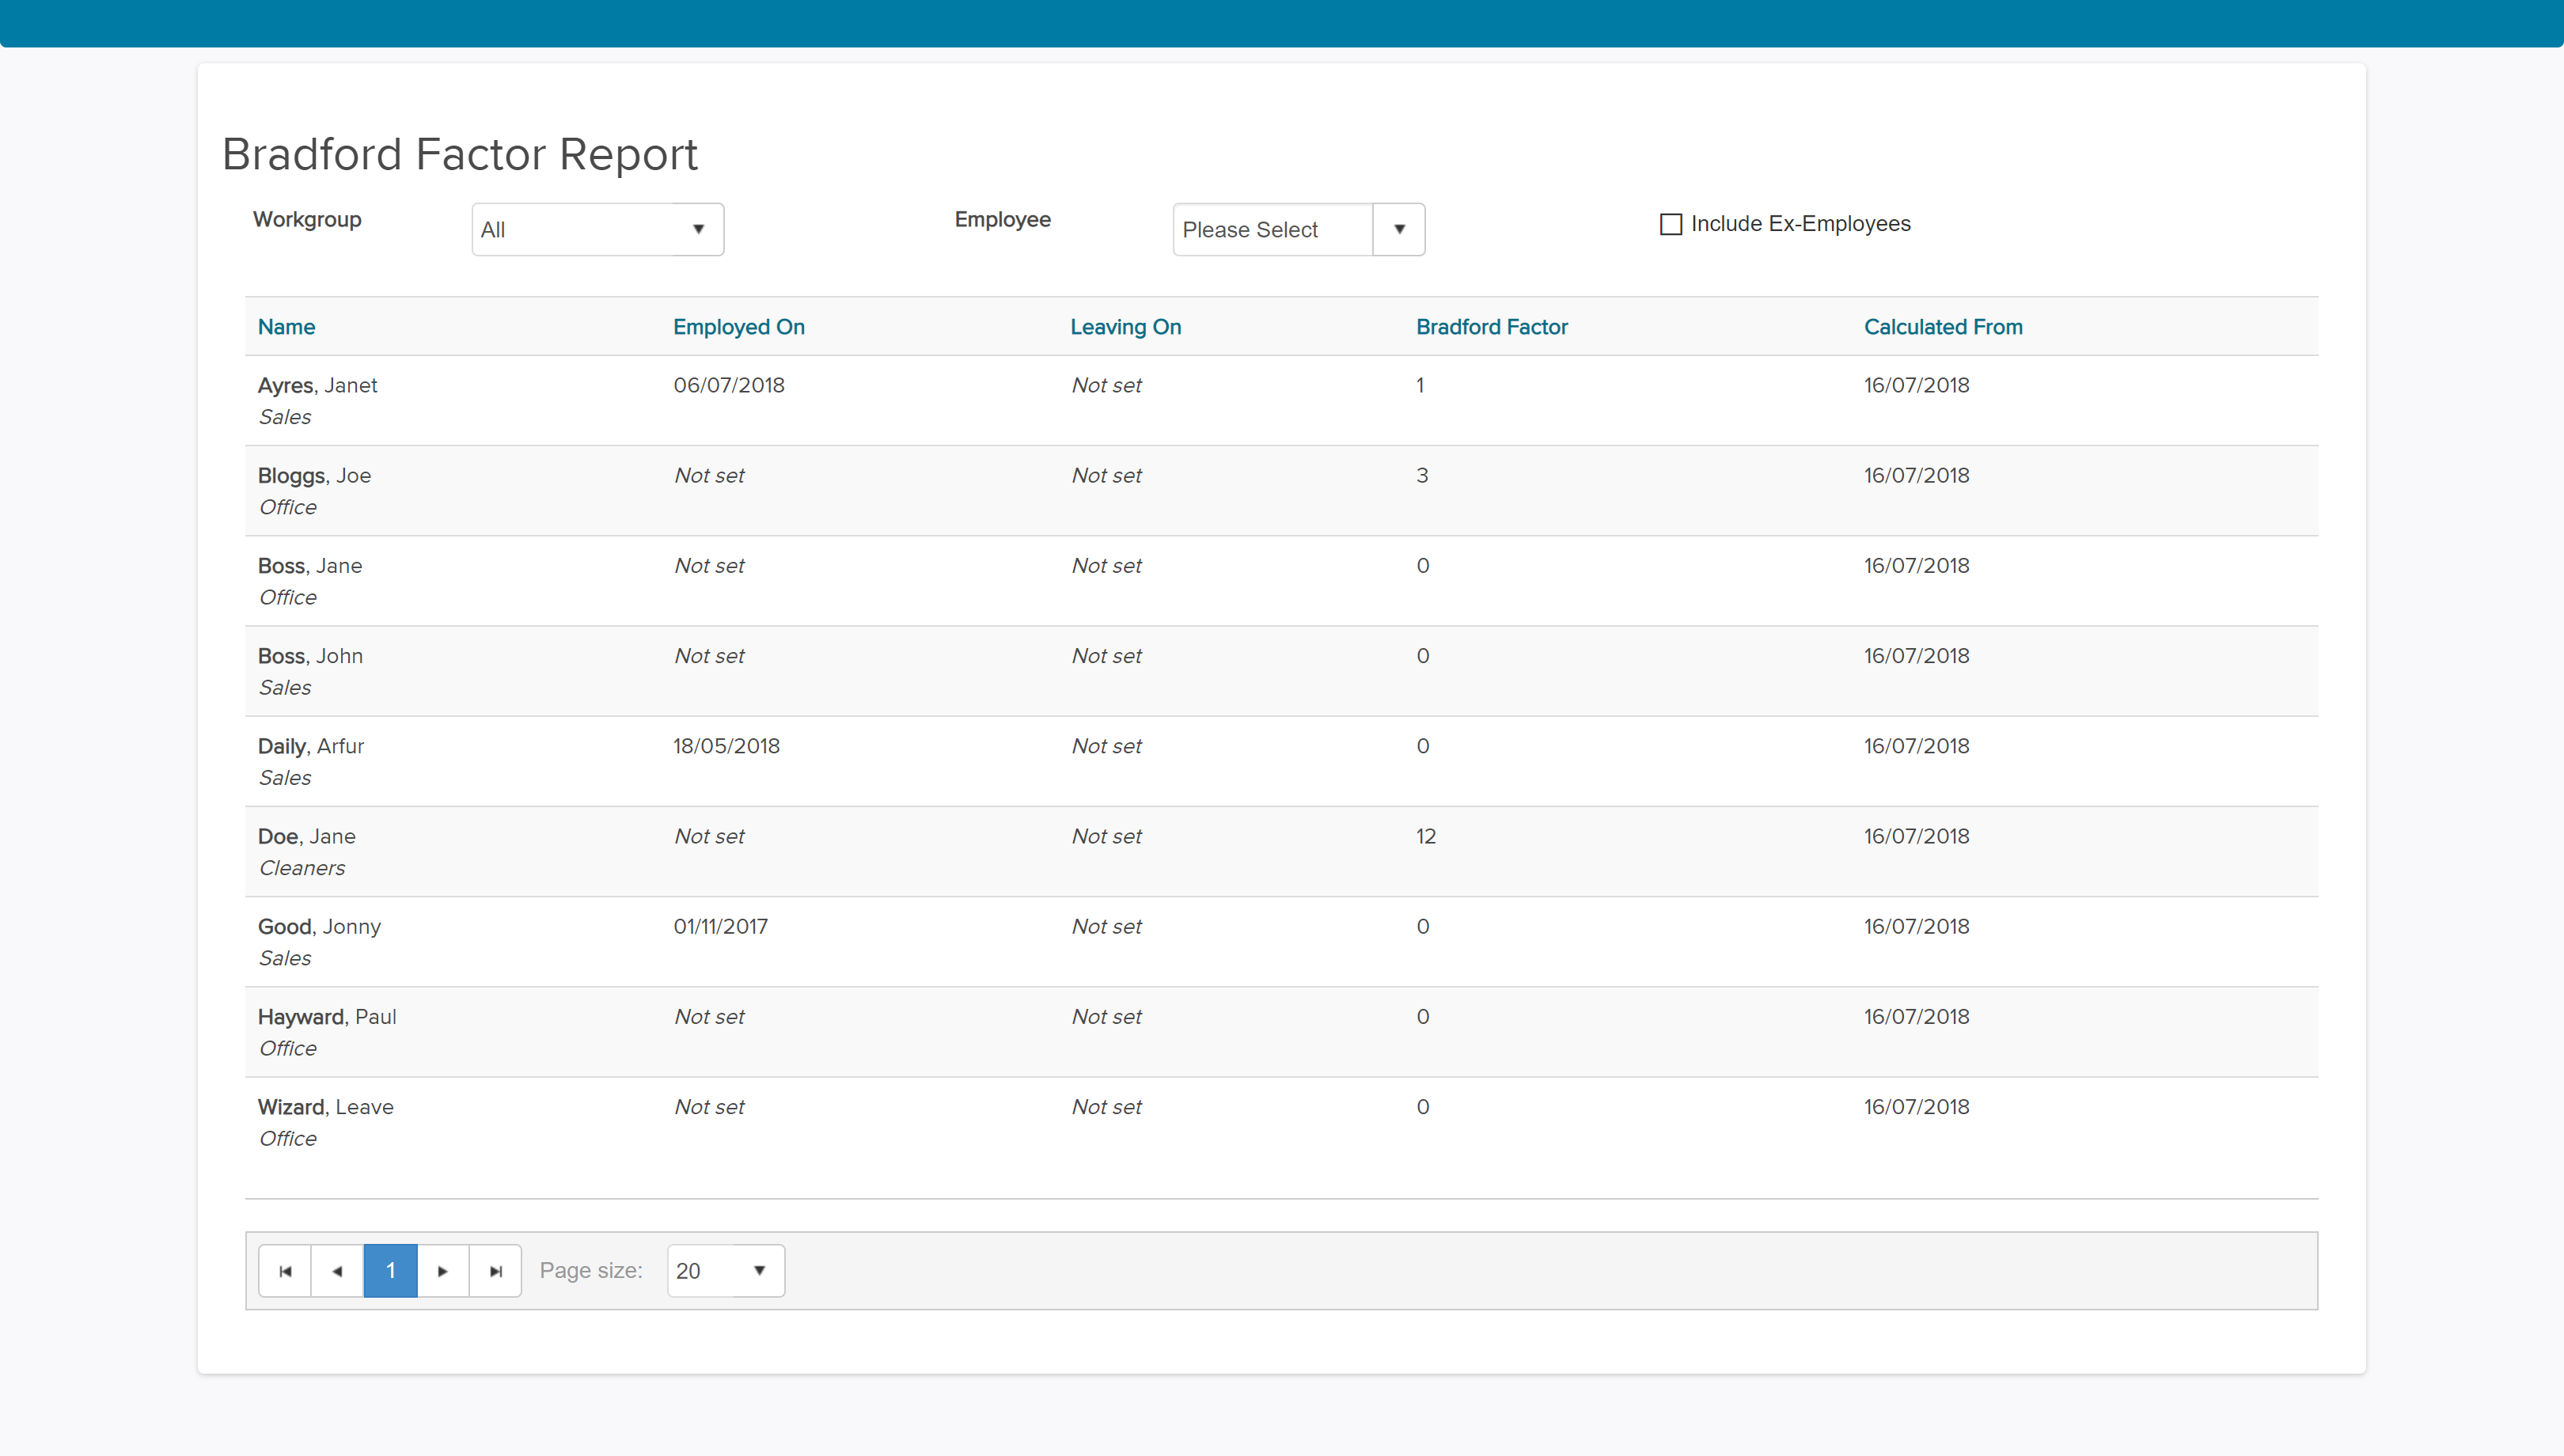
The system paginates the results, and you can select the page size. Initially, it sorts the list by ‘Name’, the first column of the list, in ascending order. You can, however, sort by any column (employed on, leaving on, Bradford Factor or calculated from) by clicking the column title. Clicking the same column again will alternate between ascending and descending order. For example, clicking ‘Bradford Factor’ twice will sort the previous list as follows: